What is brain MR spectroscopy used for?
MR spectroscopy gives a chemical profile of a region of brain. This is useful in differentiating normal brain tissue from tumor, regions with ischemia, or other tissue abnormalities.
Abnormal areas identified on structural MRI are typically compared to the normal contralateral area as a control.
A summary of the basic physics of brain MR spectroscopy
Most clinic MR spectroscopy is done using spectra derived from protons. Because the resonant frequency of a proton is altered by its chemical environment, each biological chemical (eg. lactate) produces a peak at a different resonant frequency. The power detected at a given radio frequency is therefore proportional to the amount of a specific kind of bio-molecule in a region of interest. Normal neural tissue has a stereotypical spectrum and abnormal tissue has an altered spectrum.
Because the absolute resonant frequency of a chemical species varies with the strength of the magnetic field used for imaging, current software packages plot power as a function of relative frequency, PPM (parts per million), rather than absolute radio frequencies. Both signal-to-noise ratio and the absolute separation between peaks increase with magnet strength, so the the higher the MRI magnet the better the spectra.
Basic interpretation principles of MR spectra
Many (but not all) bio-molecules can be detected in porton MR spectra. Four bio-molecules are most commonly used:
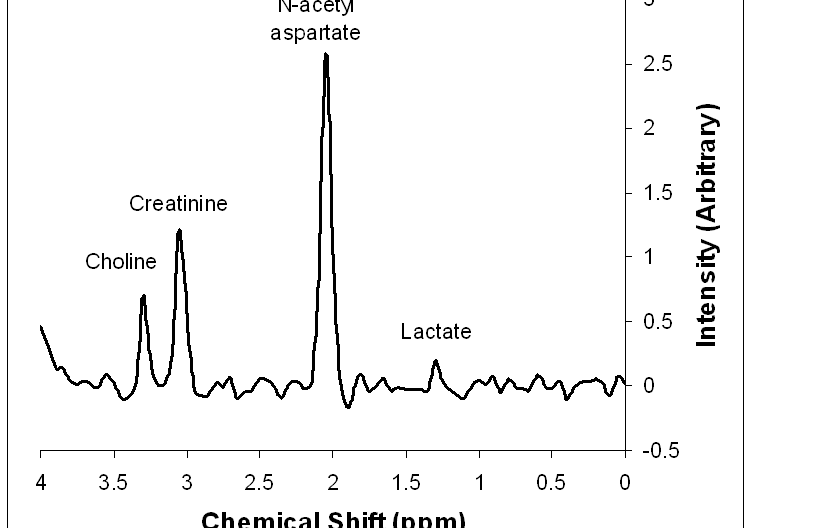
- N-acetyl aspartate (NAA) is a marker of intact neurons. Regions devoid of neurons or with damaged neurons will show low NAA levels. NAA appears at 2.0 ppm.
- Creatine is a marker of energy stores. Gray matter has more creatine than does white matter. Creatine appears at 3.0 ppm.
- Choline is a marker of cellular turnover. The higher the choline to creatinine ratio, the more cellular turnover is occuring in the region (eg. regions with rapidly growing tumor or inflammation have high choline). Choline appears at 3.2 ppm.
- Lactate is a measure of anaerobic metabolism in an area and is typically associated with ischemia. When present, a peak or trough for lactate appears at 1.3 ppm.

Figure 1: Peaks in MR spectroscopy. This is a simulated spectrum of brain tissue with a small lactate peak to show its position, although the lactate peak is not typically present in normal tissue.
Tumor spectra
MR spectra of tumors vary primarly by the growth rate of the tumor rather than whether they are primary brain tumors or metastatic growths.
- Rapidly growing tumors deplete their energy stores so have lower creatine than in normal tissue
- Rapidly growing tumors have high cellular turnover so have high choline levels.
- Areas where neuronal tissue is replaced by tumor have reduced NAA levels.
- Meningiomas have a high alanine concentration, so an alanine peak is often present at 1.48 ppm.
Ischemia spectra
- Acute ischemia results in a switch to anaerobic metabolism with development of a lactate peak (1.3 ppm).
- Infarction results in an increase in the lipid peaks between 0.9 and 1.4 ppm corresponding to tissue breakdown products.
References
Fundamentals of MR Spectroscopy John R. Hesselink, MD, FACR